
PTS

Product Tracing System


01
Project Overview
When two or more people get the same illness from the same contaminated food or drink, the event is called a foodborne illness outbreak. Along with the CDC (Center for Disease Control), the FDA investigates outbreaks to control them, so more people do not get sick in the outbreak, and to learn how to prevent similar outbreaks from happening in the future.
The FDA’s Coordinated Outbreak Response and Evaluation (CORE) Network was created to manage not just outbreak response, but surveillance and post-response activities related to incidents involving multiple illnesses linked to FDA-regulated human food, dietary supplements, and cosmetic products.
However, The CORE team currently uses mostly manual processes to organize and sort through requested documents from industry. As part of the FDA Food Safety Modernization Act (FSMA), pilot projects to evaluate methods and appropriate technologies for rapid and effective tracking and tracing of foods are being undertaken in advance of the new food safety rules and requirements coming into effect in January of 2026.
Precise was given the opportunity to work with the FDA to improve a basic food tracing prototype that had been developed with partners.
In the summer of 2022, the Innovation Team along with several summer interns undertook a UX redesign of the app and further develop the capabilities of the AI and machine learning features.
Problem Statement
FDA CORE team members use manual and outdated techniques such as Excel and Word to organize and sort through industry documentation in order to determine the cause of a outbreak, which takes time and furthers the risk to the public.
The Goal
Improve the functionality and user experience of a rough prototype so that CORE team members can use automated processes online to help trace products and determine the cause of an outbreak.
The Team
The team consisted of 10 members. Team members included the VP of Engineering, VP of Health IT, the Chief Technical Officer, several developers, a BA, and a UX designer.
My Role
I worked as the solo UX designer and graphic designer on the project.
02
Prototype Review
A Gap Analysis was completed by members of the team on the existing prototype to evaluate it for errors, missing elements, and user experience issues.
Technical Gap Analysis
Some of the findings from the Technical Gap Analysis
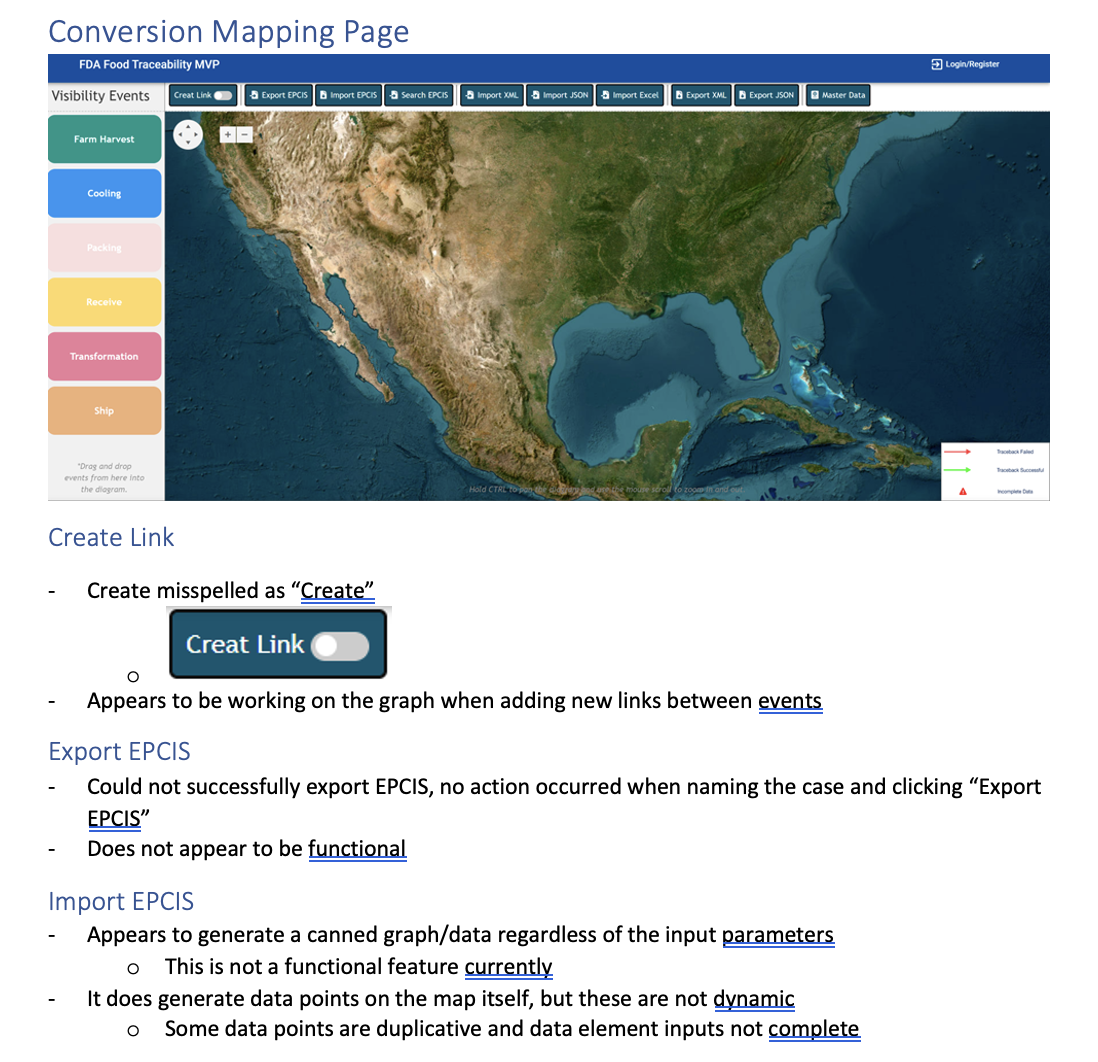
UX Analysis
I completed an analysis of the prototype to look for user issues not found in the technical Gap Analysis.

Some of the findings from the UX Analysis
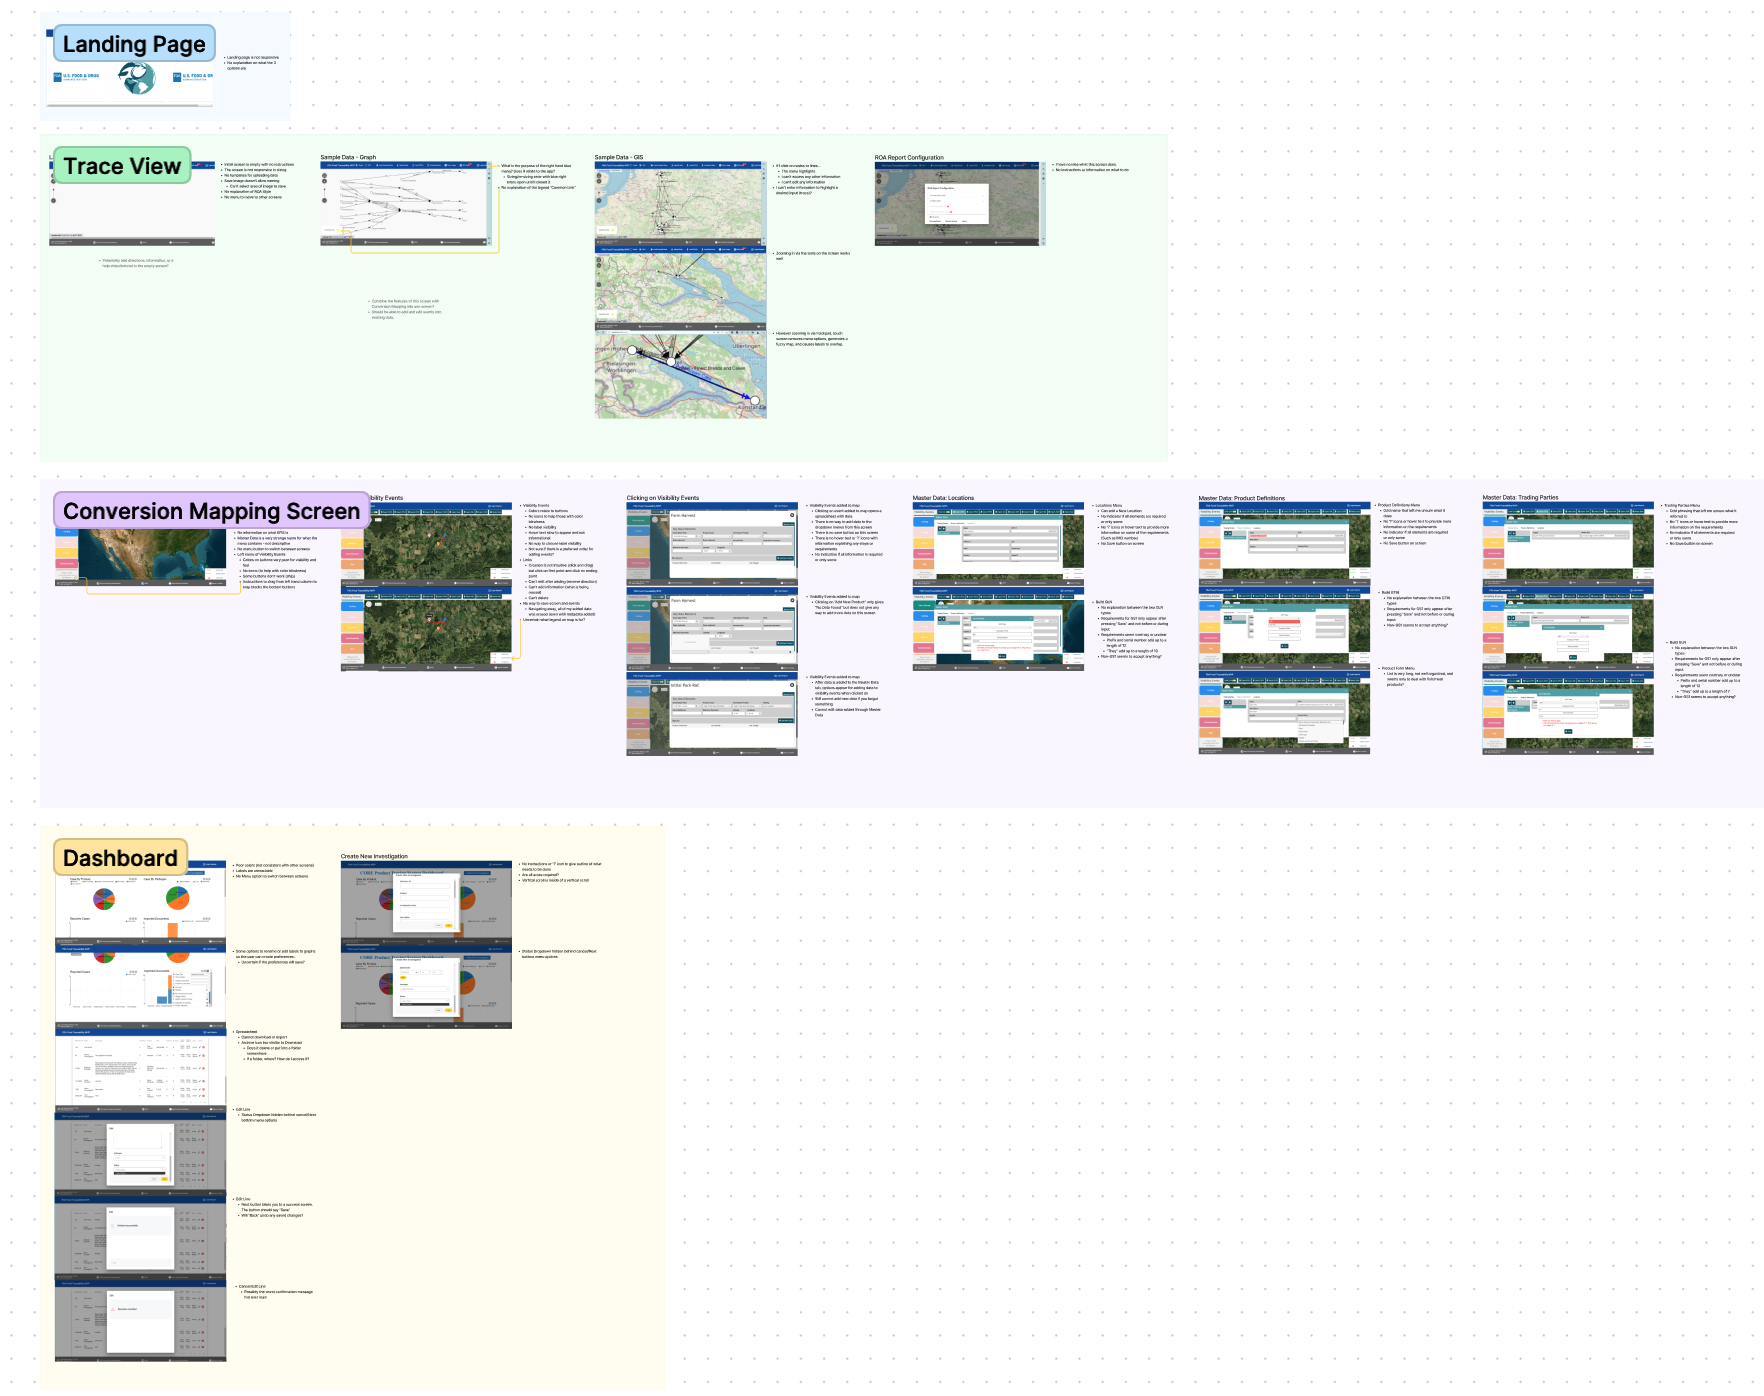
All of the issues found during the UX Analysis
03
User Research
No user research had been done when creating the existing prototype, so we pivoted to fill in this gap. I drafted a User Research plan, got it approved with stakeholders, and then requested volunteers during a remote meeting after an explanation of the findings in the UX Analysis along with an overview of what User Experience Design was.
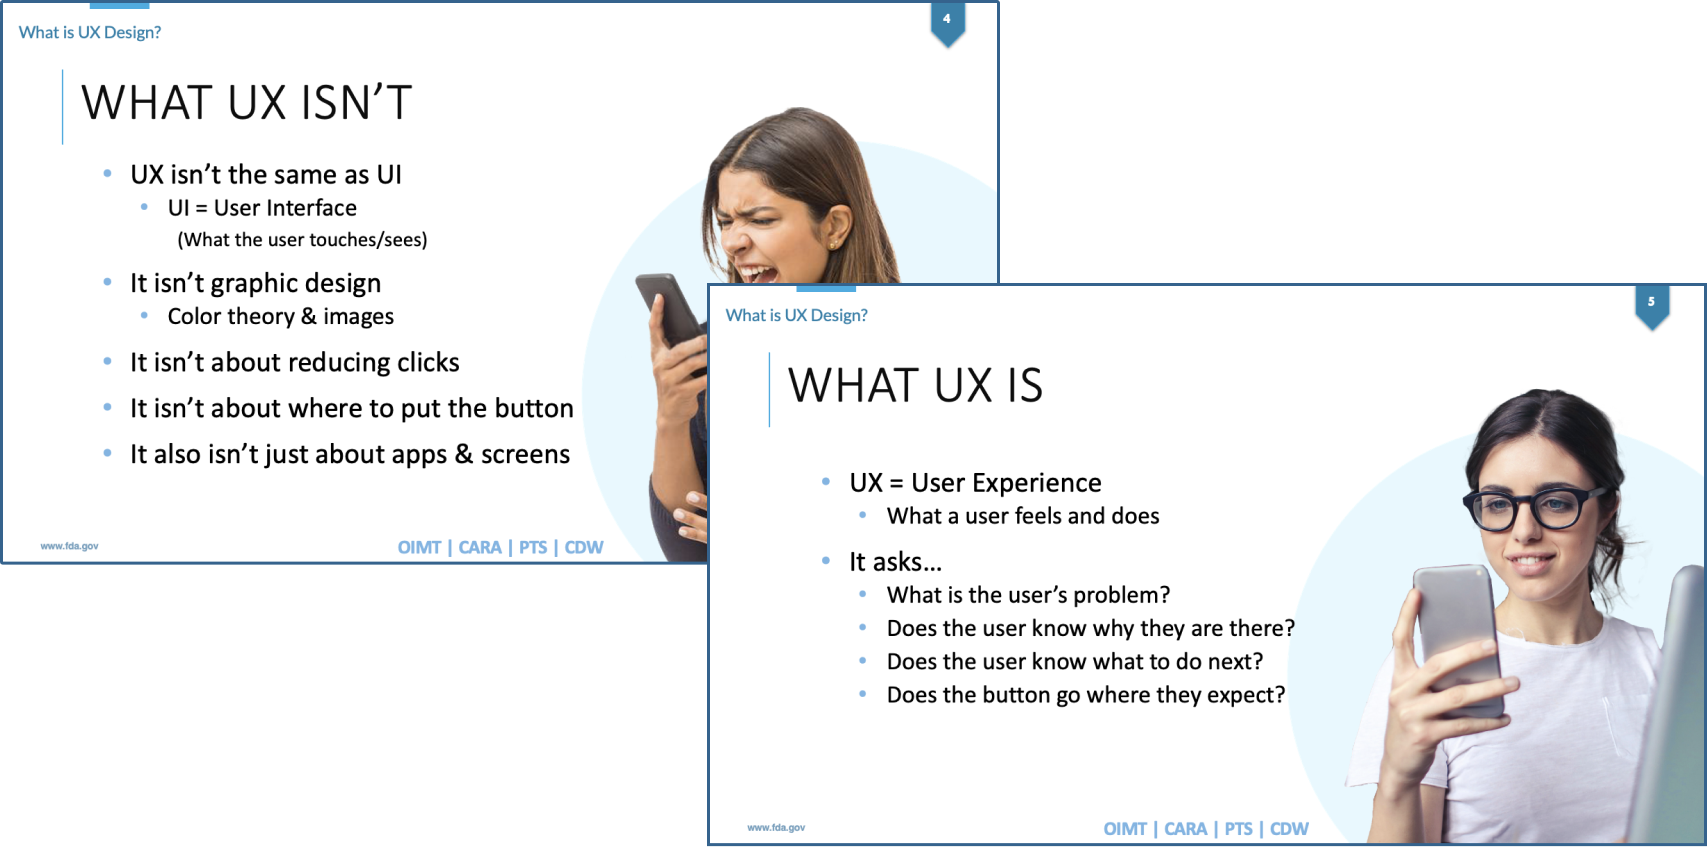
User Research Plan

UX Introduction PowerPoint
Affinity Map
User interviews were undertaken from Feb 26 to March 10 in 2023 with 6 volunteers in a variety of roles over a period of two weeks. After the interviews, the key points were collected and organized into an affinity map.
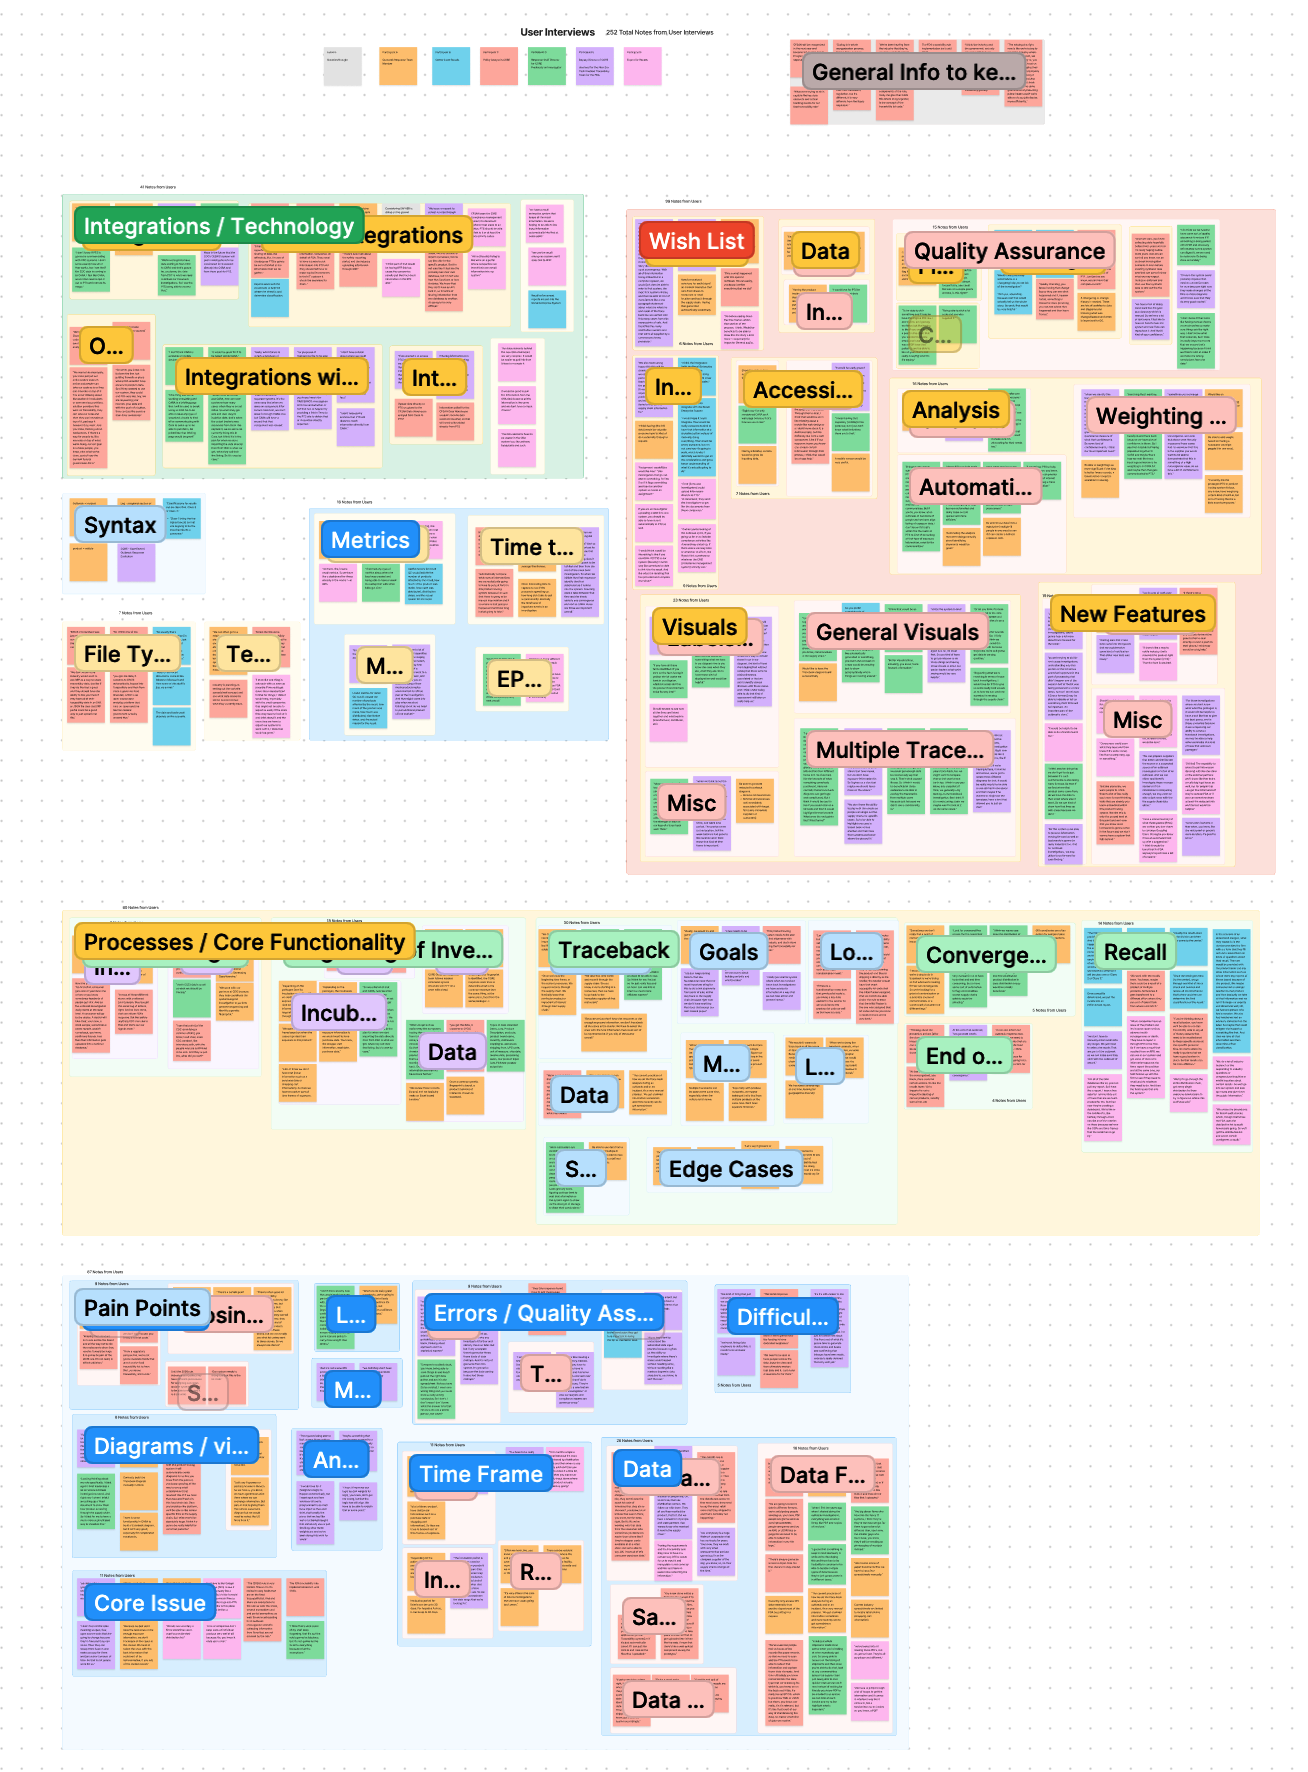
All data collected from participants in the user interviews.
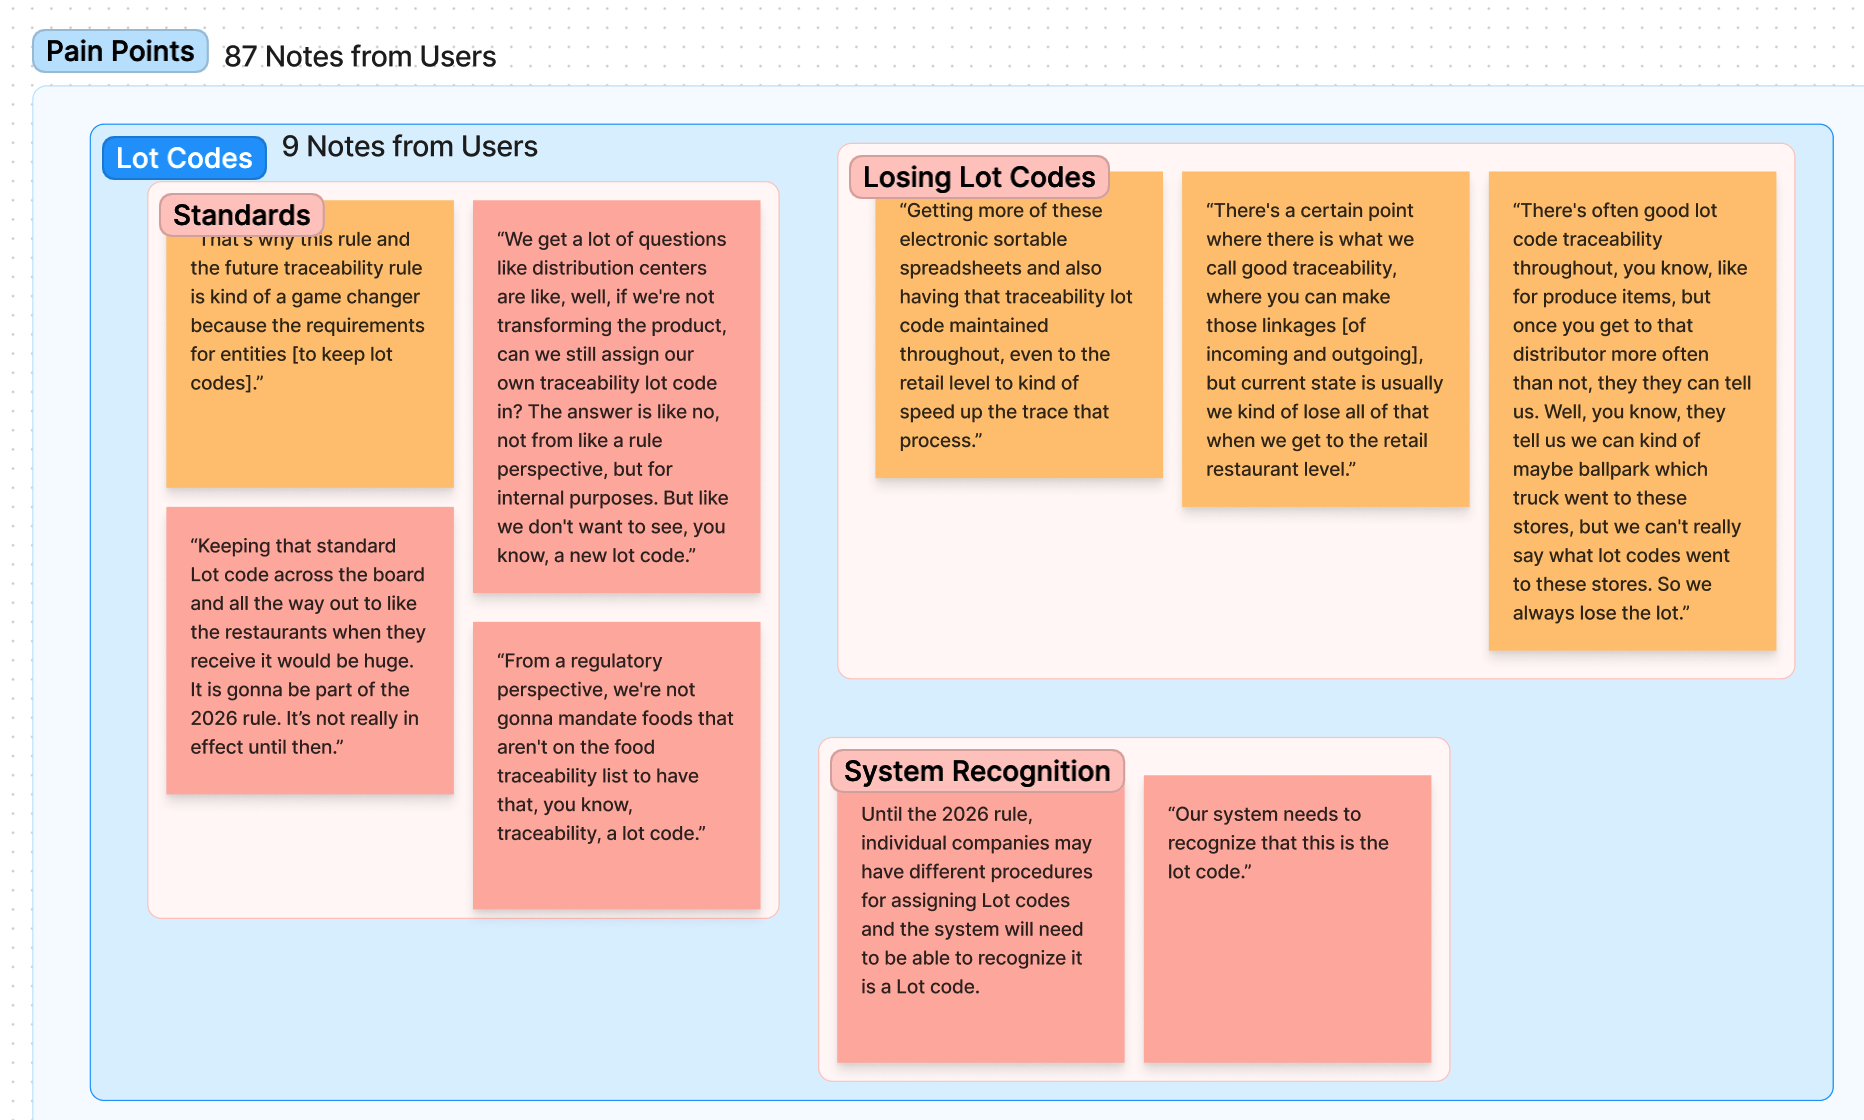
Example of collected pain points from users.
Themes & Insights
The organized pain points and user hopes were then collated into a themes and maps document, that helped prioritized user needs. These were also cross-referenced with any applicable Business Requirements.


All organized data from the user interviews (above) and an example of one page from the pain points section (left).
Personas
Based on user interviews and research into how the CORE Team functions, four user personas were created to capture the key users of the PTS prototype.


Example of two of the personas created from user interviews.
04
Wireframes
With the personas in place and user research created, we began ideating on what the improved screens and functionality of the prototype could look like.
Flow for Investigations
To make sure we didn’t miss any pivotal steps, we outlined the flow investigations take.

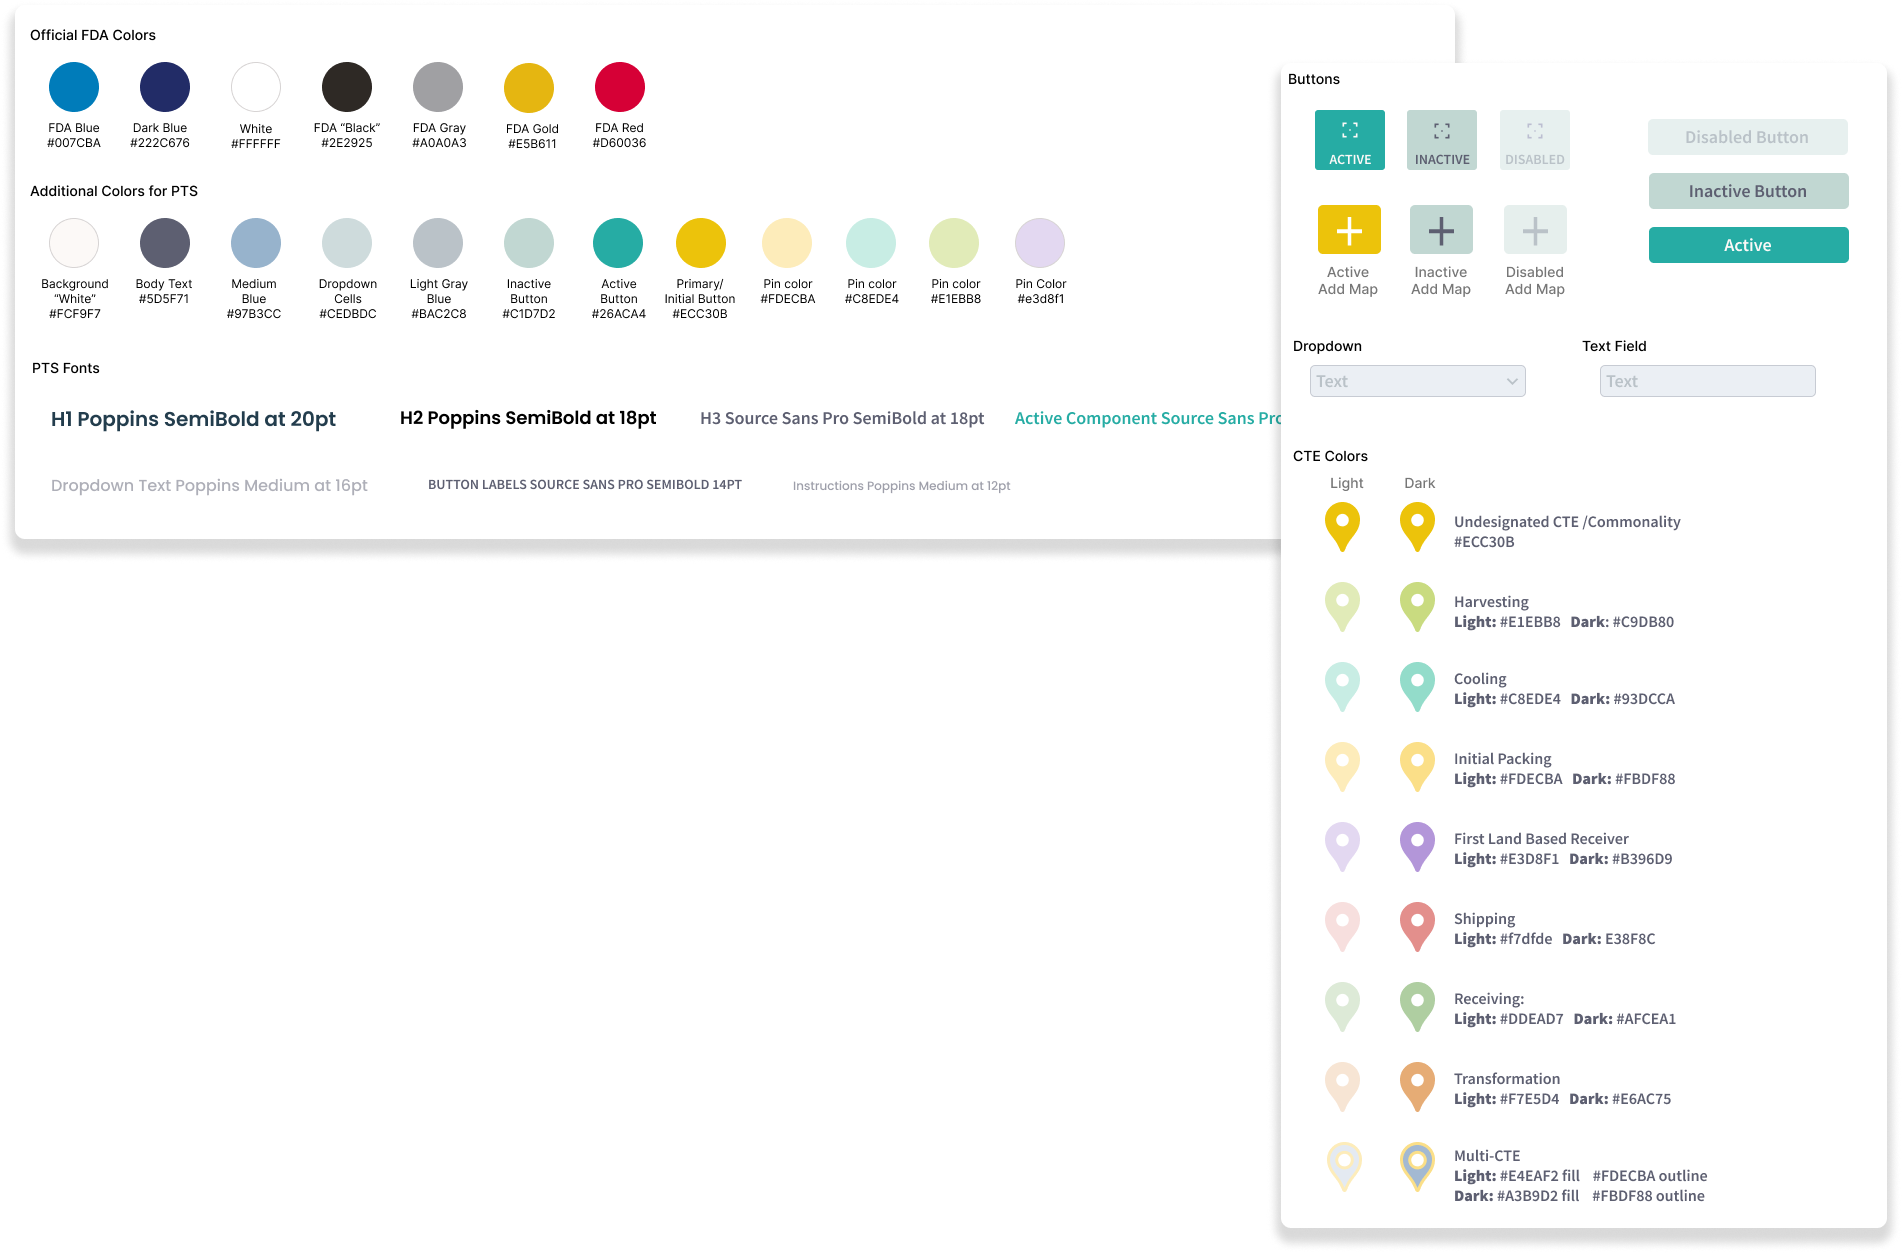
Initial Brand Guide
Using Coolers, I created a color scheme that was soothing, considering the time demanding and high stress task being undertaking. It also needed to work with both GIS and street maps, while reflecting the agricultural and commodity based framework the colors would represent.
Low Fidelity Wireframes
From paper wireframing sessions, I took the favorite parts of ideas and created low fidelity wireframes to discuss with the stakeholders and users.

An idea for a GIS mapping interface.
High Fidelity Wireframes
It was decided that the first use of the PTS prototype would be integrated in a system used by the CORE Team called CARA (CORE Analytics and Research Application). CARA was tested out by team members where we screenshot some of its different abilities, and then spoke with the development team and users. I then updated the wireframes to show how PTS could look and function within CARA.
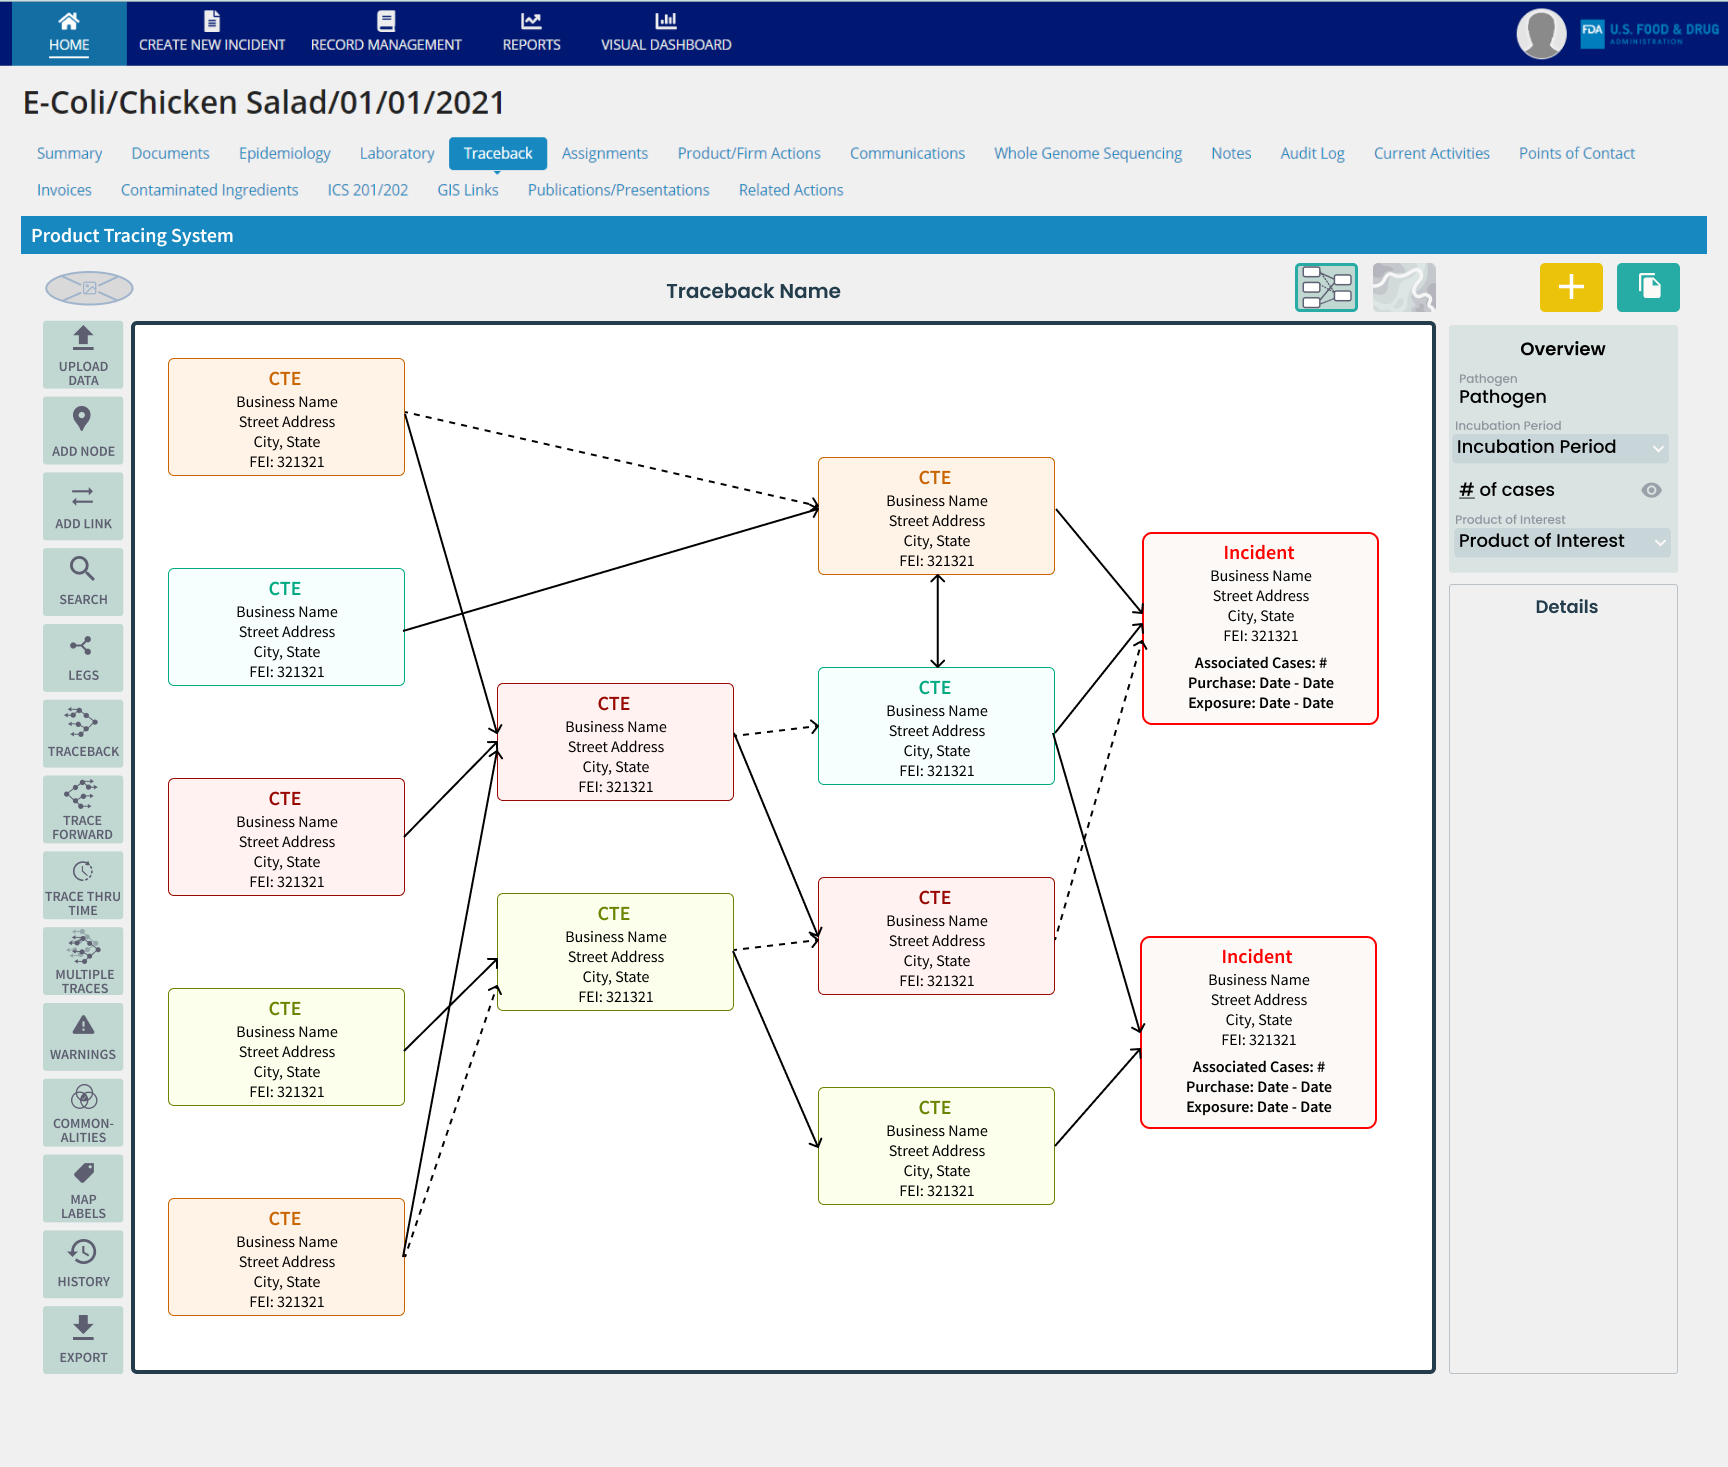
Grid view of PTS outbreak investigation embedded in CARA
05
User Flows
Before prototyping, the user flow for each button was mapped out to develop the screens and actions needed in this complex design.
Screen Flows
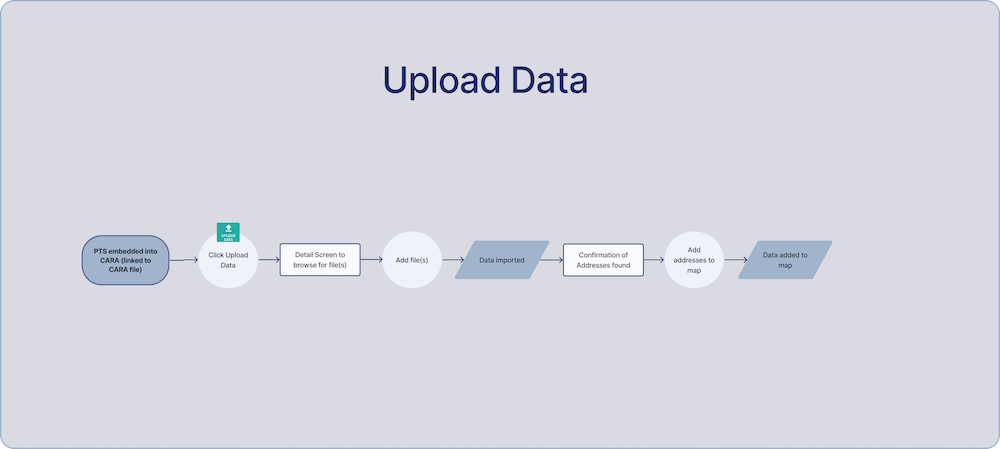
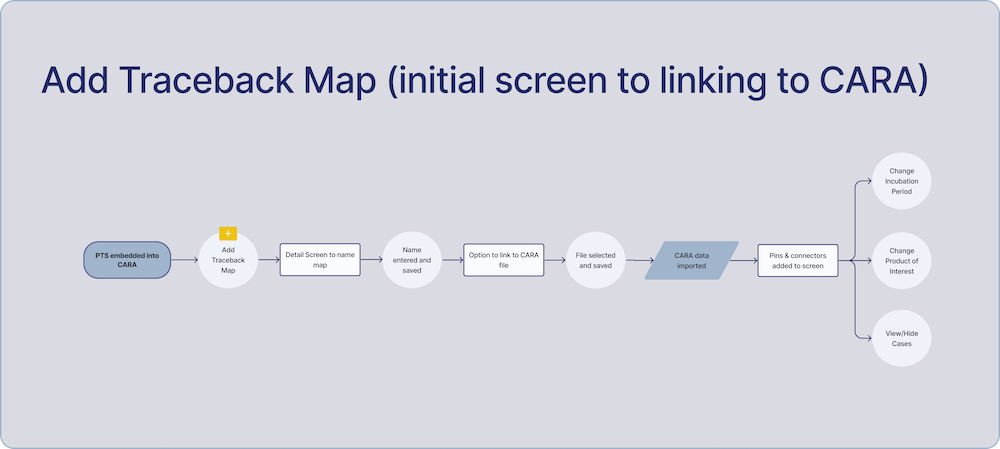
Examples of screen flows for each button
Wireframes
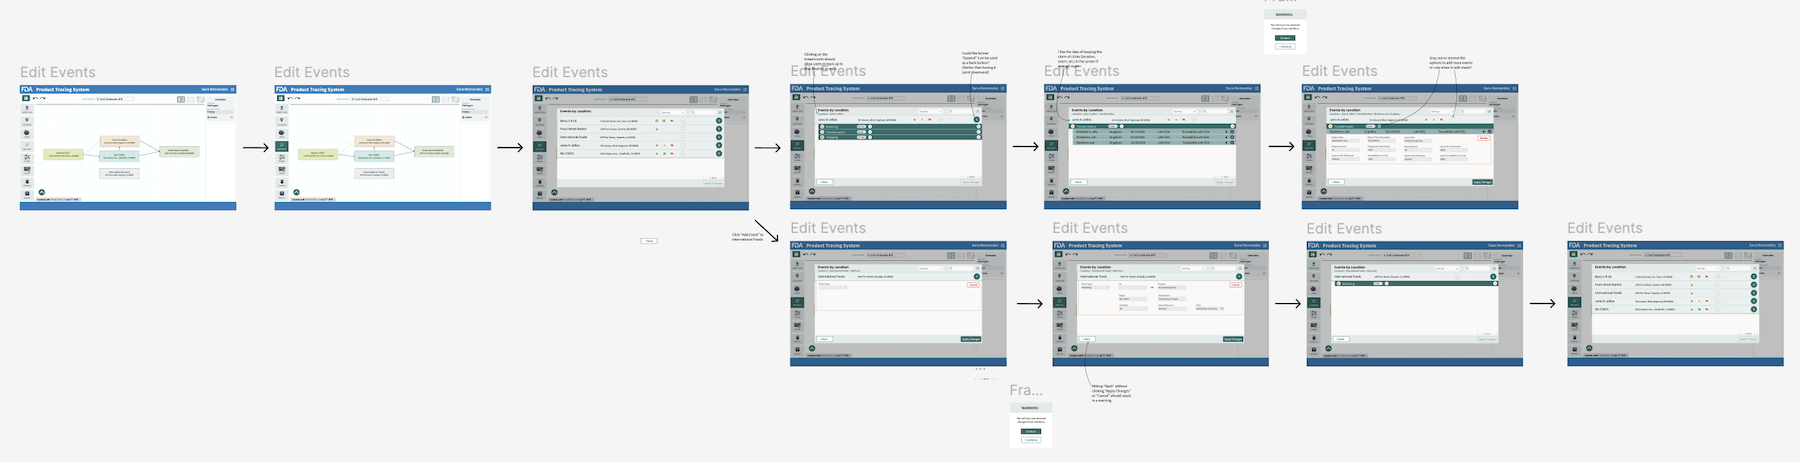
Wireframes with notes, including an overview “sheet,” were created to map out the various user steps. These were then discussed for tweaks internally and with users.

All of the user flows laid out via wireframes for the GIS mapping view of an outbreak traceback.

Example of wireframes for the “warning” button
06
Prototype Update
The time constraints of the prototype improvement as well as the set number of targeted improvements requested by the FDA in order for them to determine which version of the prototype they will go forward with, led us to moving development to updating the existing prototype prior to user testing.
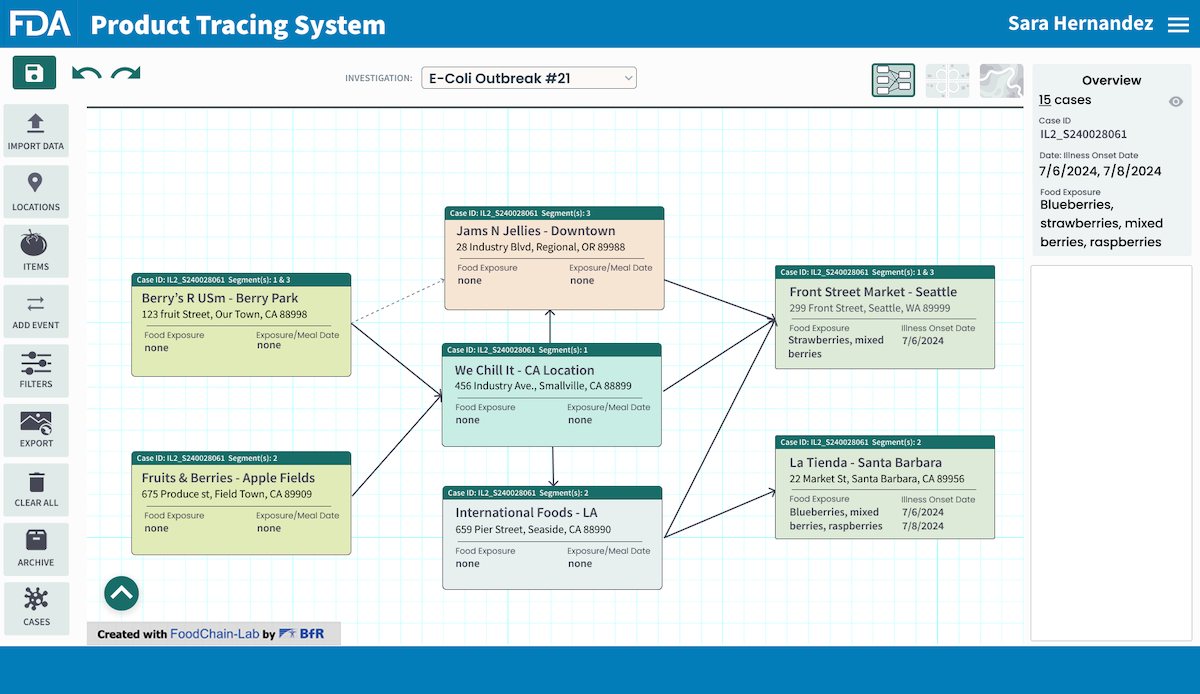
Prototype Update
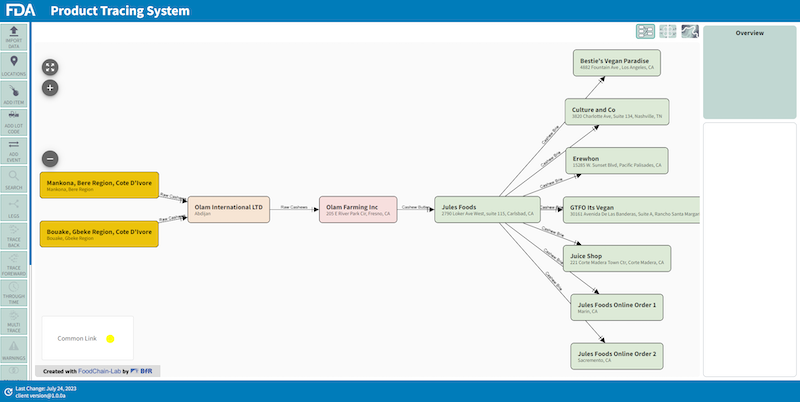
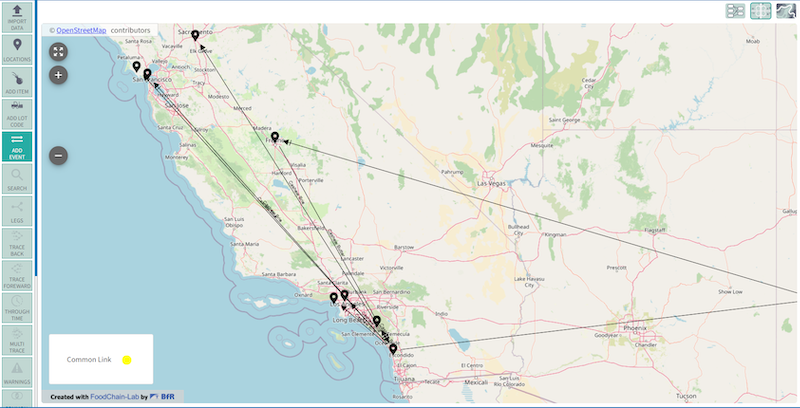
Updated tracing view and map view of the prototype
Short video of the prototype
07
User Testing
In August of 2023, 15 users tested the updated prototype for specific functionality goals critical for the FDA. The testing window was a two week period where users followed testing scripts using provided data.
Testing Goals & Plan

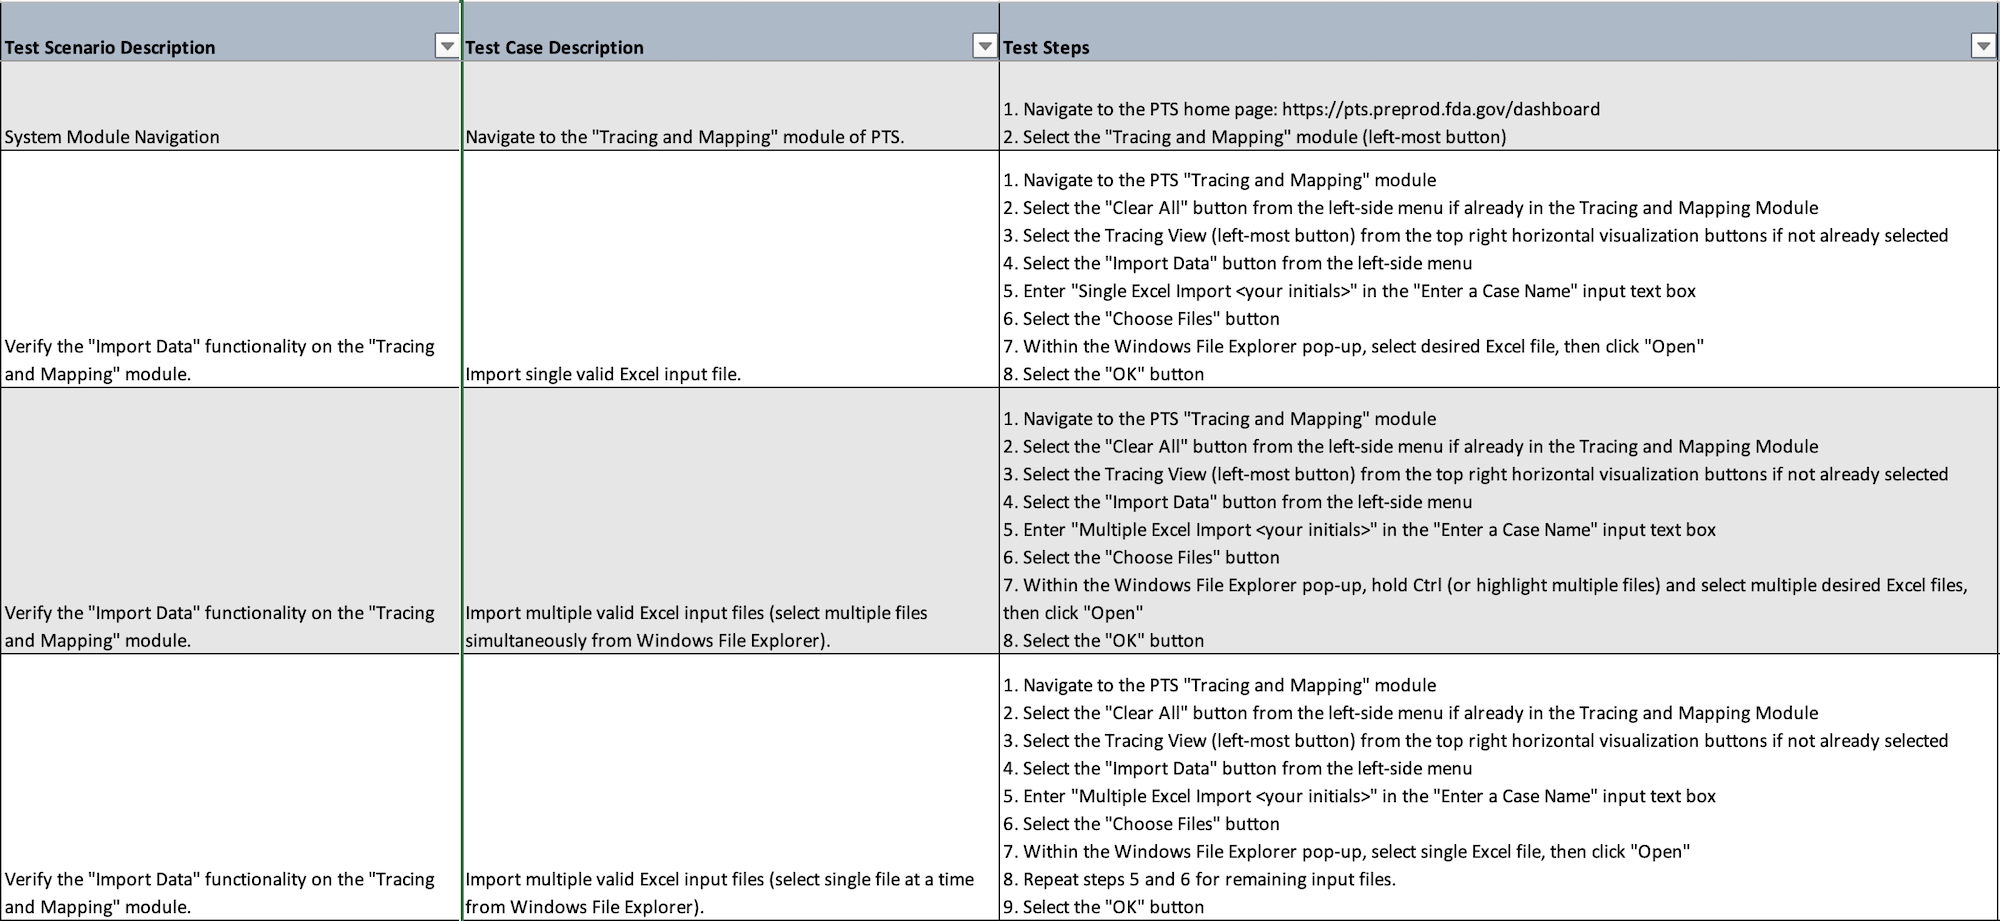
Example of the scripts from the user testing plan
Prototype Updates
After the user testing, the updated prototype along with the results and feedback from the user testing was handed over to the FDA along with a report. The FDA will then made a determination to go forward with our prototype.
Changes were made to update the app to make it more user friendly. Additionally, a green light was given to add more features to help investigators and clean up some contrast issues. The app went through some changes, such as cleaning up the button sidebar on the left, focusing and simplifying the most important user flows. Additionally, I played with a few ideas for a logo to help bring the prototype to life.
The updated wireframe with the simplified button bar and deeper information in each node.
New user flows were created, reviewed, and tested before being handed off to the dev team.
Logo Ideas

08
Next Steps
The product is currently in beta testing, being used to shadow current real investigations as a means of continual user testing as additonal features are added. The Final Rule for compliance has been pushed back 2028, giving the team additional time to built features into this complicated app that will bring the FDA into a new era for investigating foodborne illnesses.
Though unfinished and still being built, PTS has already shown great promise. In the investigations where it has been used, it has shown a 2 day lead in discovering the source of outbreaks compared to the old, manual system. Even unfinished, PTS has shown it will go a long way in protecting the public health and safety.

09
Lessons Learned
Working on the prototype of the Product Tracing System was fun as much as it was eye opening. Getting a chance to see behind the scenes of how the FDA conducts traceback investigations and goes about report outbreaks was an amazing experience. I felt so impressed and sympathetic to the hard working investigators using Word and Excel while scanning through boxes of paper receipts—many of which industry isn’t even currently required to keep. I’m now a champion of the 2026 Food Tracability law.
As a UX designer, I wanted to make the work easier for the investigators and the supervisors and press liasons who need to access updates and metrics as well as make the process faster and more robust to protect the public. I’ve had family members caught up in delayed outbreak announcements and seriously ill. This project touched home.
However, I will also say that working as the solo designer was, at times, challenging. There are so many user flows to this prototype to be able to make it do what the users need it to that it could be intimidating to develop each while trying to recognize the need to access other functions while in different workflows. Plus, I was the only designer on two other projects with tight deadlines as well during the same time frame as PTS. I could have used some backup. When I look at the designs now, I see room for improvement.
Considering this as we moved forward with new user flows, I worked with the PM and BA to focus on well defined user flows based on the needs of the CORE team. Progress has been going well and the early results of improving the outbreak source has given us a huge boost.
Additionally, comments from the users before and after the interviews will remain with me for a long time; many said they had never been asked what they needed to do their job before. This is why we do UX, and it really sank home in this project for both helping the end users but also protection public health.